
This post explains how to install and access Tanzu Contour, Promethous and Grafana on Tanzu clusters deployed by Cloud Director Container Service extension. so to get started first ensure TANZU CLI is installed on your local machine, if not then you can install by following documentation given Here
Next thing you need is the kubeconfig file of your target TKG cluster which is reachable from your local client machine on which you have installed Tanzu CLI, also make sure you run:
# tanzu init
Installation Steps
NOTE: CSE4 provisioned TKG cluster, cert-manager, kapp-controller, secretgren-controller and tanzu-standard package repository already have been installed. so you can skip step1,2 and 3.
Step:1- Install kapp-controller
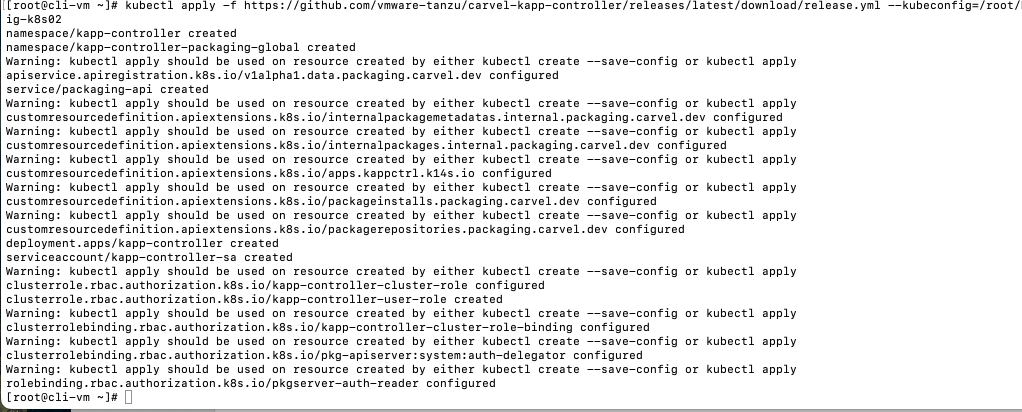
kapp-controller gives us a flexible way to fetch, template, and deploy our applications to Kubernetes. It will also keep our apps continuously up to date when the configuration in our source repository changes. Install kapp-controller in the cluster using:
#kubectl apply -f https://github.com/vmware-tanzu/carvel-kapp-controller/releases/latest/download/release.yml
Step:2- Install secretgren-controller
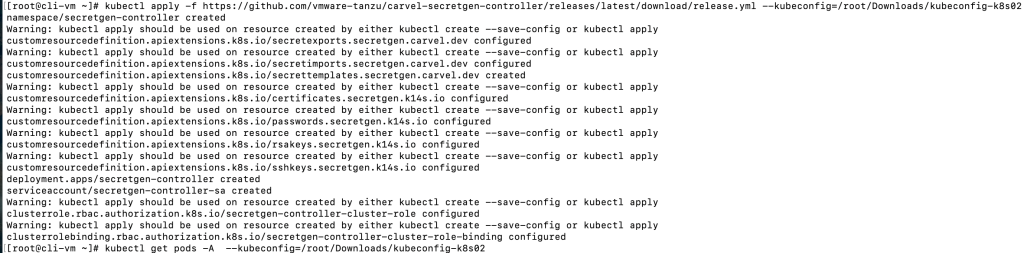
In order to manage secrets across namespaces, Tanzu utilizes the carvel secret-gen-controller. you can install secretgren-controller in the cluster using:
#kubectl apply -f https://github.com/vmware-tanzu/carvel-secretgen-controller/releases/latest/download/release.yml
Step:3- Install cert-manager
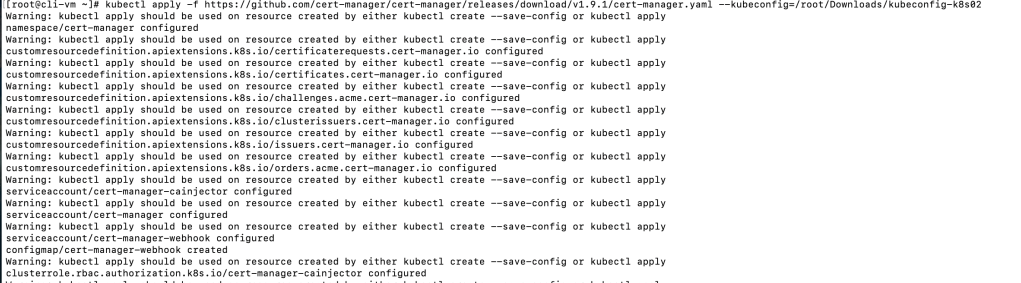
Install cert-controller in the cluster using:
#kubectl apply -f https://github.com/cert-manager/cert-manager/releases/download/v1.9.1/cert-manager.yaml
Verify Tanzu Packages
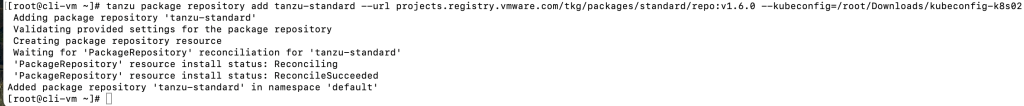
Using the Tanzu CLI, you can install packages from the built-in tanzu-standard package repository or from other package repositories that you add to your target cluster, such as the Tanzu Application Platform Repository. Install tanzu-standard package repository v1.6.0.
#tanzu package repository add tanzu-standard --url projects.registry.vmware.com/tkg/packages/standard/repo:v1.6.0
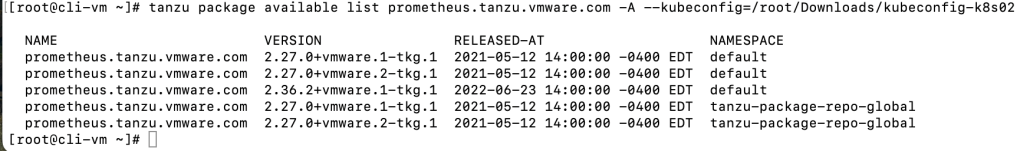
Verify that the Prometheus package is available in your Tanzu K8s cluster as well as retrieve the version of the available package:
#tanzu package available list prometheus.tanzu.vmware.com -A
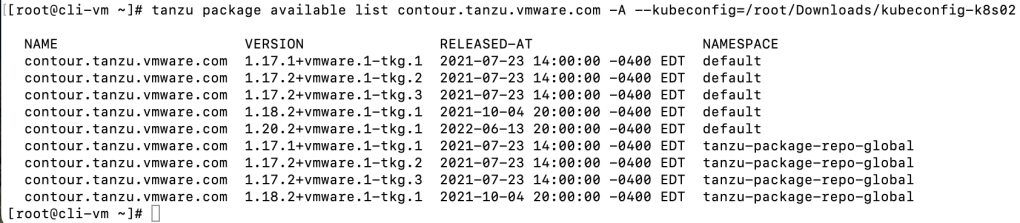
Verify that the Contour package is available in your Tanzu K8s cluster as well as retrieve the version of the available package:
#tanzu package available list contour.tanzu.vmware.com -A
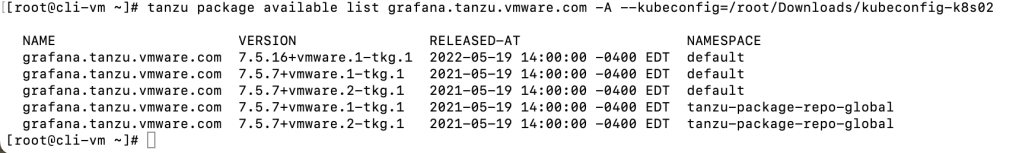
verify that the Grafana package is available in your Tanzu K8s cluster as well as retrieve the version of the available package:
#tanzu package available list grafana.tanzu.vmware.com -A
Step4:- Implement Ingress Control with Contour
Contour is a Kubernetes ingress controller that uses the Envoy edge and service proxy. Tanzu Kubernetes Grid includes signed binaries for Contour and Envoy, which you can deploy into Tanzu Kubernetes (workload) clusters to provide ingress control services in those clusters.
You must first create the configuration file that will be used when you install the Contour package and then install the package. you can generate config file using:
#tanzu package available get contour.tanzu.vmware.com/1.20.2+vmware.1-tkg.1 --values-schema

#tanzu package available get contour.tanzu.vmware.com/PACKAGE-VERSION -generate-default-values-file
I am using below using data-values.yaml for contour
envoy:
  service:
    type: LoadBalancer
  hostPorts:
    enable: false
  hostNetwork: false
certificates:
  useCertManager: true
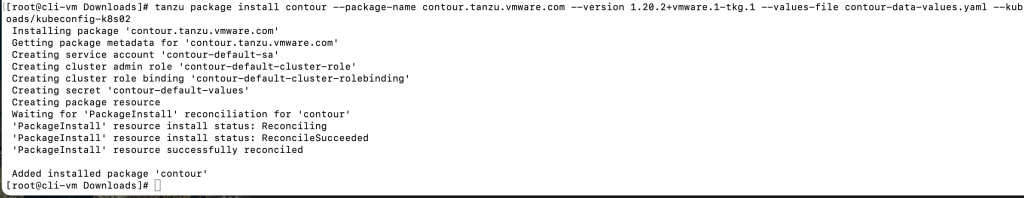
Install the package as below:
#tanzu package install contour --package-name contour.tanzu.vmware.com --version 1.20.2+vmware.1-tkg.1 --values-file contour-data-values.yaml
Step 5:- Deploy Prometheus
Prometheus is an open-source systems monitoring and alerting toolkit. Tanzu Kubernetes Grid includes signed binaries for Prometheus that you can deploy on workload clusters to monitor cluster health and services.verify the configuration file using below commands, this file configures the Prometheus package.
#tanzu package available get prometheus.tanzu.vmware.com/2.36.2+vmware.1-tkg.1 --values-schema
#tanzu package available get prometheus.tanzu.vmware.com/PACKAGE-VERSION --generate-default-values-file
This command lists configuration parameters of the Grafana package and their default values. You can use the output to update your prometheus-data-values.yaml file, I have used below config file which is hosted on git, if you want you can download and use and in my config file ingress is enabled in the yaml which means it works with ingress.
https://raw.githubusercontent.com/avnish80/prometheus/main/prometheus-data-values.yaml
Install/update/delete prometheus pkg using below commands..
#tanzu package install prometheus --package-name prometheus.tanzu.vmware.com --version 2.36.2+vmware.1-tkg.1 --values-file prometheus-data-values.yaml

#tanzu package installed update prometheus --values-file prometheus-data-values.yaml

#tanzu package installed delete prometheus

Step 6:- Deploy Grafana
Grafana is open-source software that allows you to visualize and analyze metrics data collected by Prometheus on your clusters. Tanzu Kubernetes Grid includes a Grafana package that you can deploy on your Tanzu Kubernetes clusters. verify the configuration file, this file configures the Grafana package..
#tanzu package available get grafana.tanzu.vmware.com/7.5.16+vmware.1-tkg.1 --values-schema

##tanzu package available get grafana.tanzu.vmware.com/PACKAGE-VERSION --generate-default-values-file
This command lists configuration parameters of the Grafana package and their default values. You can use the output to update your grafana-data-values.yml file, I have used below config file which is hosted on git, if you want you can download and use and in my config file ingress is enabled in the yaml which means it works with ingress.
https://raw.githubusercontent.com/avnish80/grafana/main/grafana-data-values.yaml
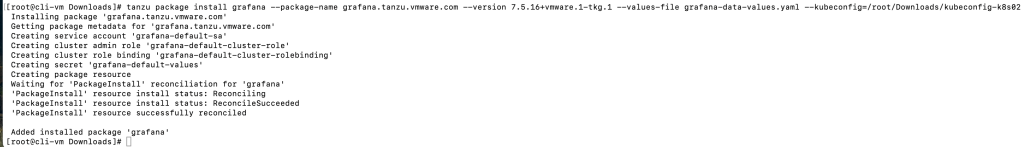
#tanzu package install grafana --package-name grafana.tanzu.vmware.com --version 7.5.16+vmware.1-tkg.1 --values-file grafana-data-values.yaml

#tanzu package installed update grafana --values-file grafana-data-values.yaml

#tanzu package installed delete grafana
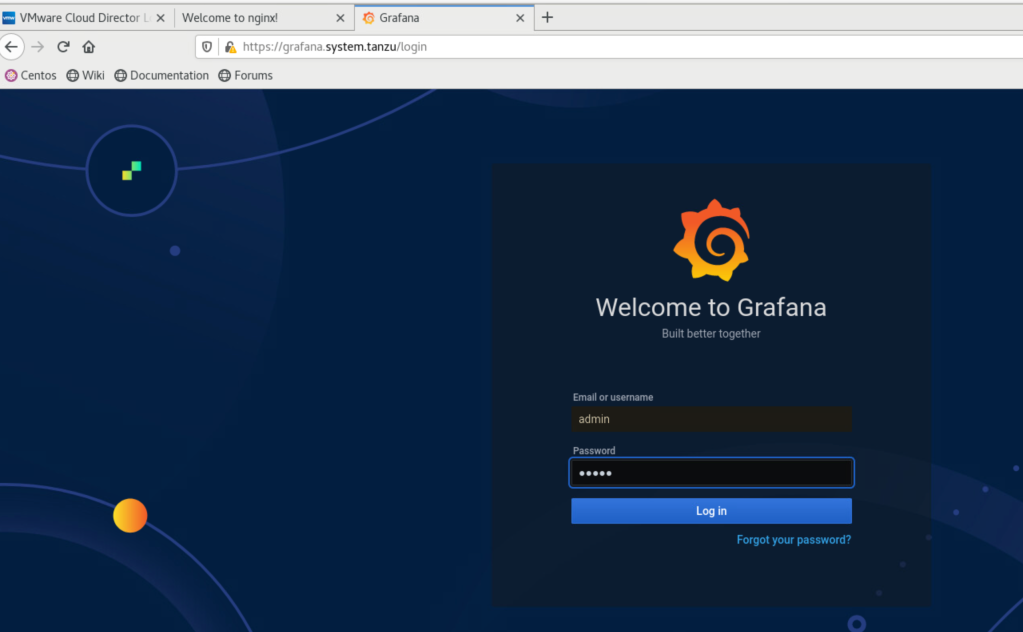
Access the Grafana Dashboard
After Grafana is deployed, the grafana package creates a Contour HTTPProxy object with a Fully Qualified Domain Name (FQDN) of grafana.system.tanzu. To use this FQDN to access the Grafana dashboard, Use the IP address of the LoadBalancer for the Envoy service in the tanzu-system-ingress namespace.

In case FQDN to access the Grafana dashboard does not work
- Create an entry in your local
/etc/hostsfile that points an IP address to this FQDN: - Use the IP address of the LoadBalancer for the Envoy service in the
tanzu-system-ingressnamespace. - Navigate to
https://grafana.system.tanzu.
Another issue is because the site uses self-signed certificates, you might need to navigate through a browser-specific security warning before you are able to access the dashboard.
